
- Included below are all Tables and Figures we refer to in ECG Blog #42. By offering them separately here - We hope to facilitate side-by-side viewing as you read through Blog 42. (Please also check out the relevant PDFs we provide links for below for full interactive discussion and more on the differentiation of WCT Rhythms):
==========================
 |
| Figure 1: 12-lead ECG obtained from a patient whose BP was dropping. Click HERE to return to ECG Blog #42. |
==========================
 |
| Table 1: One should always assume VT until proven otherwise whenever you encounter a regular WCT without sinus P waves. Statistically – at least 80-90% of all regular WCT rhythms of uncertain etiology will turn out to be VT (which is why we list VT for the first 8-out-of-10 causes on this list). Less commonly – one may see a supraventricular etiology with either preexisting bundle branch block or aberrant conduction. |
==========================
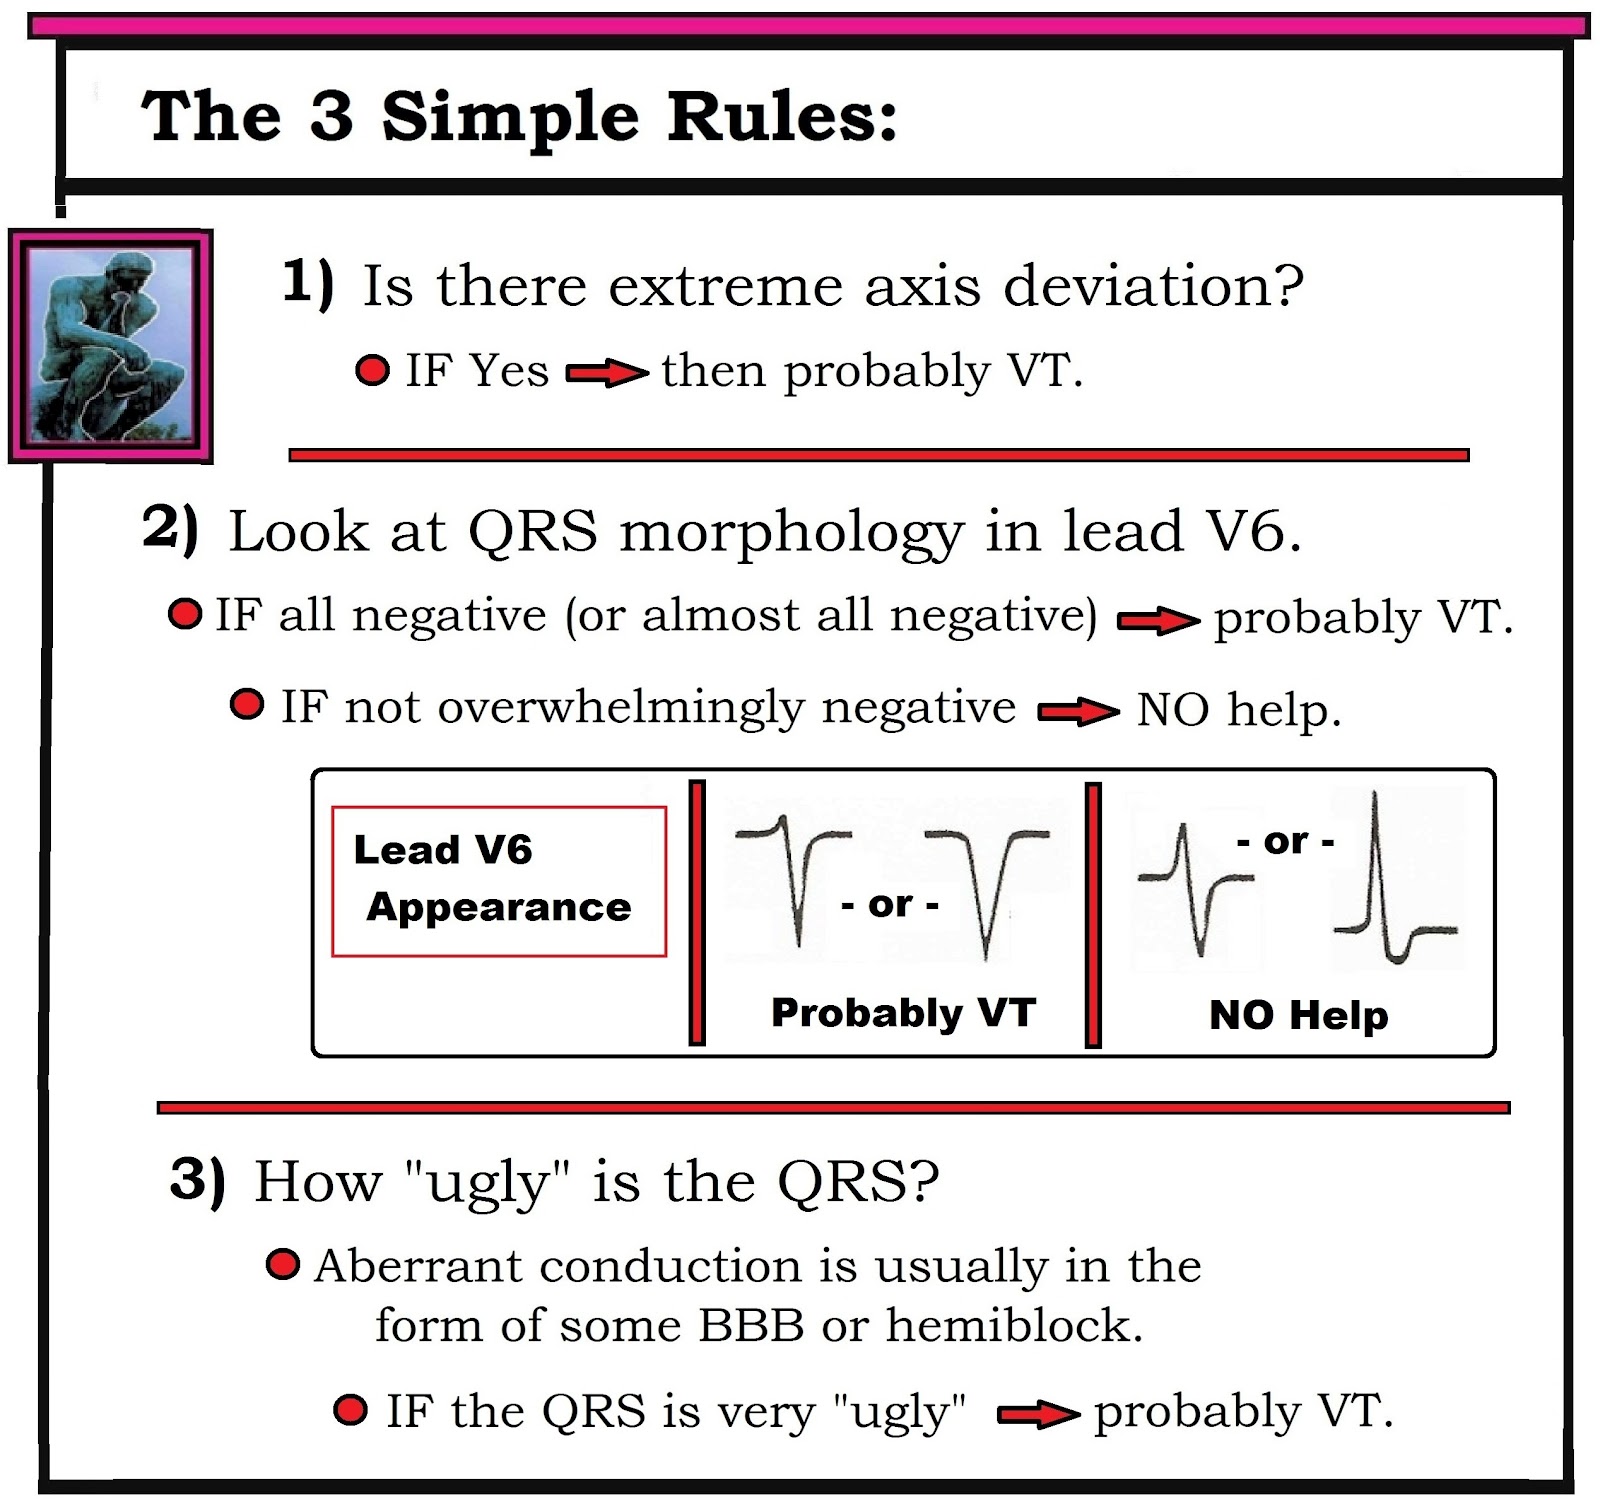 |
| Table 2: After applying Table 1 (ie, "Assume VT until until proven otherwise) - we move to the 3 Simple Rules - which in our experience is often all that is needed for near-definitive diagnosis. |
==========================
 |
| Figure 2: Attention to selected ECG features of QRS morphology may be helpful in ruling in or out VT. We focus on leads V1 and V6. The presence of either an entirely negative QS in lead V6 (complex J) or an almost entirely negative complex (I) – is highly suggestive of VT. In contrast – greater positivity in lead V6 (G,H) is nondiagnostic. Aberrant conduction is suggested by a typical rsR’ (taller-right-rabbit-ear) morphology in lead V1 (A,B). The presence of any other predominantly upright complex in lead V1 strongly suggests VT (C,D,E,F). We intentionally exclude reference to LBBB aberration in this figure – because both VT and SVT may manifest WCT rhythms that resemble LBBB. |
==========================
 |
| Figure 3: The finding of a delayed R-to-S nadir (to >0.10 second) in any precordial lead is highly suggestive of VT (1st example taken from lead V2). The absence of a delayed R-to-S nadir in any precordial lead is nondiagnostic. Shown above is an example (from lead V4) in which the very slender initial r wave and steep S wave downslope result in an R-to-S nadir that clearly does not exceed 0.10 second. |
==========================

Figure 4: The presence of a large upright R
wave in lead aVR during a WCT rhythm is virtually diagnostic of VT (since this
finding implies ventricular activation begins in the apex). Finding a QR
complex or a small amplitude complex (2nd and 3rd examples shown) is
nondiagnostic.
==========================
Selected REFERENCES:
- Brugada P, Brugada J, Mont L, et al: A New Approach to the Differential Diagnosis of a Regular Tachycardia with a Wide QRS Complex. Circulation 83:1649-1659, 1991.
- Blomstrom-Lundqvist C, Scheinman MM, Aliot EM, et al: ACC/AHA/ESC Guidelines for Management of Patients with Supraventricular Arrhythmias- Executive Summary. J Am Coll Cardiol 42:1493-1531, 2003.
- Vereckei A, Duray G, Szenasi G: Application of a New Algorithm in the Differential Diagnosis of Wide QRS Complex Tachycardia. Eur Heart J 28:589-600, 2007.
- Sasaki K: A New Simple Algorithm for Diagnosing Wide QRS Complex Tachycardia: Comparison with Brugada, Vereckei and aVR Algorithms. Circulation 120:S671, 2009.
==========================
- Back to ECG BLOG #42 -
==========================
- Section 06.0 — on Using Adenosine -
- Section 07.0 — on Known VT -
- Sections 08.0, 09.0,10.0 — on The Regular Wide Tachycardia -
- Section 13.0 — on SVT of Uncertain Etiology -
-----------------------------------------------------------------------
No comments:
Post a Comment